The loss of Antarctic ice
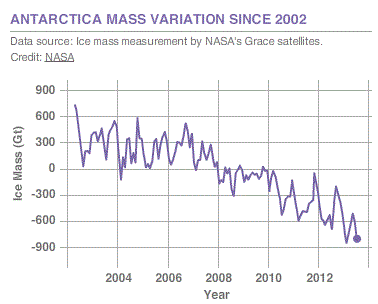
- This graph shows how the mass of Antarctic ice changed from 2002 to 2013.
- The mass is shown in thousands of millions of tonnes (gigatonnes, or Gt).
- Ice levels rise and fall with the seasons, but overall, they show a downward trend.
- As Antarctic ice melts, meltwater flows into the ocean, and NASA’s satellites detect the reduced mass of Antarctica and its ice.
Antarctica has lost 147,000 million tons of ice per year since 2003.
NASA: Vital Signs: Land Ice
The most recent graph
The most recent graph shows a more alarming loss of ice.
See the latest NASA Antarctica Mass Variation graph.
Dangers
A section of the West Antarctic Ice Sheet appears to be in irreversible decline. This melting would raise global sea levels by 1.2
If the entire Antarctic Ice Sheet melted, the sea level would rise by about 60 meters.
US National Snow and Ice Data Centre NSIDC: Cryosphere: Quick Facts: Ice Sheets
Substantial melting of the Antarctic ice might take hundreds of years, but would we want our descendants to cope with flooding in most major cities worldwide?
The A
Climate change is affecting the icy giant of the south: August 2019
It is not sustainable for us to have 147,000 million tons of Antarctic ice melting each year and significant ice sheet areas in irreversible decline.
Hub Pages: See the Footer below for links to the three hub pages, or the menu at the top of the page.
Loaded 2014. No featured image.